Title: Apple A-Peel
Grade Level: 1
Materials: Red, green, and yellow apples, student graph sheet- one per student, Blank apples- 2 per student, crayons, two large graphs, markers, tape or glue, Apples by Gail Gibbons
Purpose: The purpose of this activity is to review with students what a graph is, what a person can learn from looking at a graph, and create a graph of their own using the data in our apple-tasting activity.
Objectives:
·
TLW predict
which apples they think will be the most popular selections.
·
TLW compare the taste and appeal of each apple
type. The learner will make a decision
as to which one is their favorite from this experience.
·
TLW follow along with and participate in a discussion
and the making of the whole-class graph.
·
TLW answer questions pertaining to the data shown on
the graph.
·
TLW apply what we just did whole group to a personal
graph that shows the same results.
Following the directions is an important part of this objective.
Procedure:
Note: A variable part to this lesson will be if all students, by chance, would pick one type of apple. Then the graph we give them would have to be labeled by 2s instead of 1s. This may be difficult for some.
Closure: As students finish the graph, let them use the apple core, cut in half to make star prints. Use a small amount of paint to do the apple stamping.
Assessment:
The first performance indicator I looked at for this activity was participation. Because these graphs lead to so many questions and a lot of discussion, I expect everyone to get a chance to participate in the activity and demonstrate their learning.
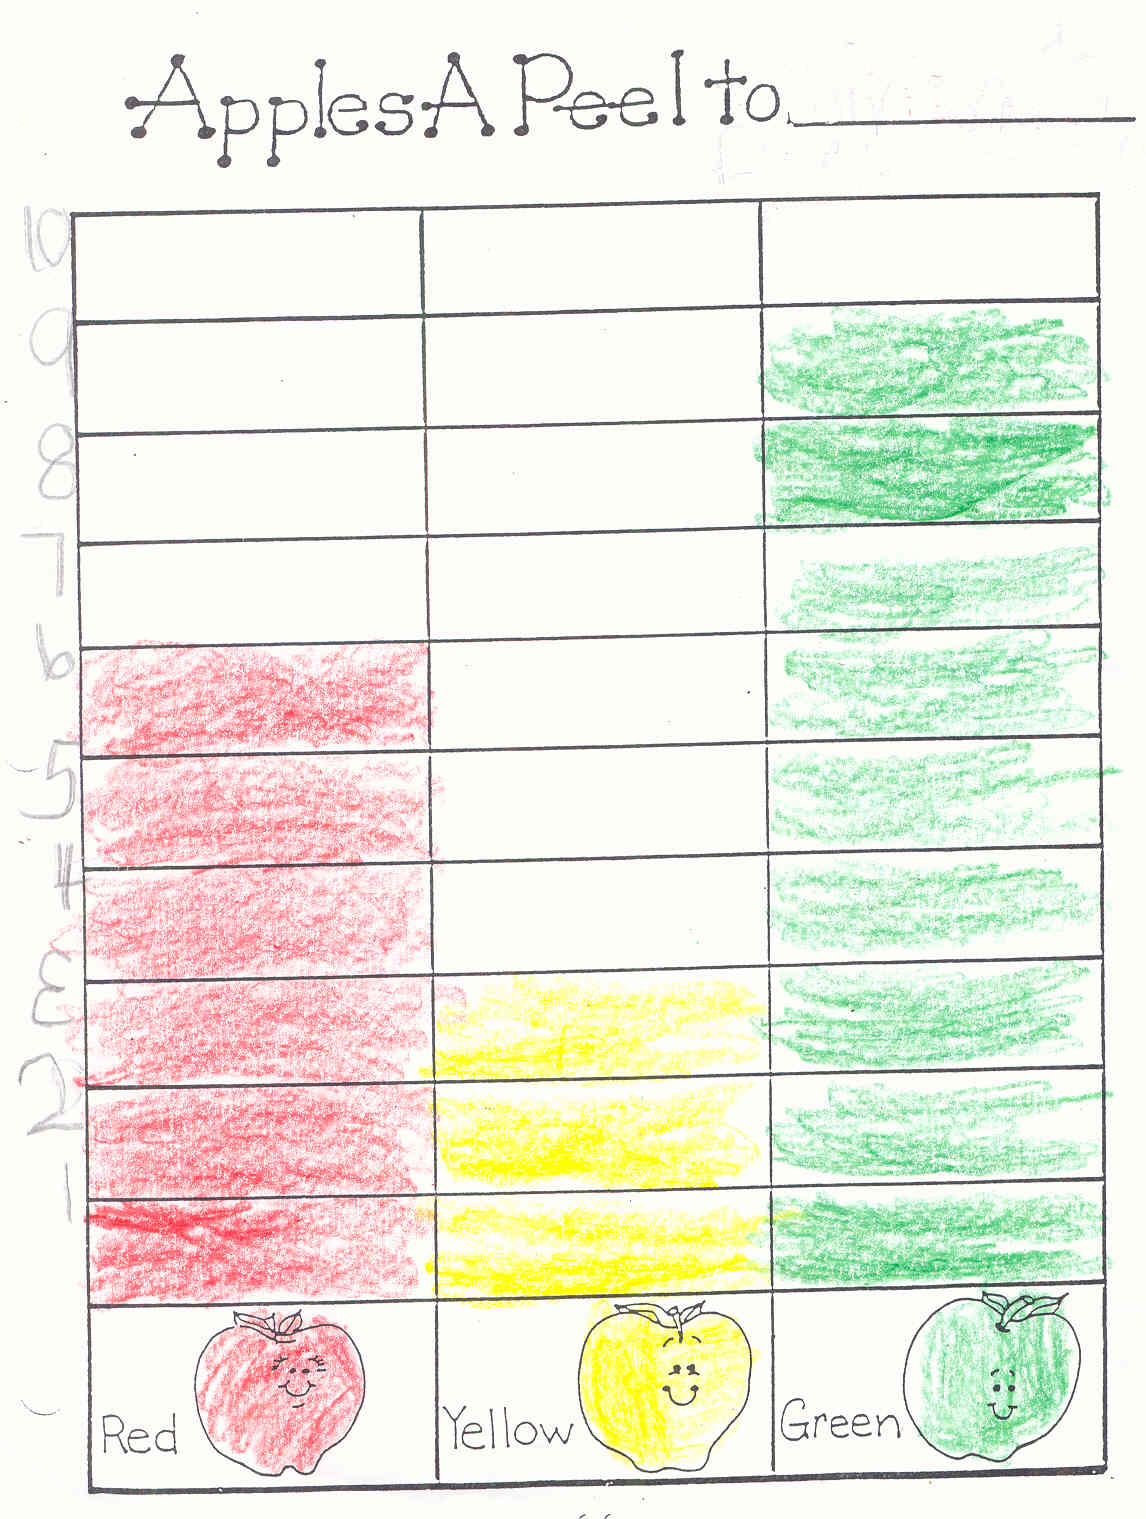
Next, I look at performance in graph making. Students are required to fill in numbers at the side to represent the number students participating, the colors of the three apples at the bottom, and the accurate number of squares should be colored in for each. I assessed their ability to graph by whether or not each student had all the necessary components needed to represent the findings.
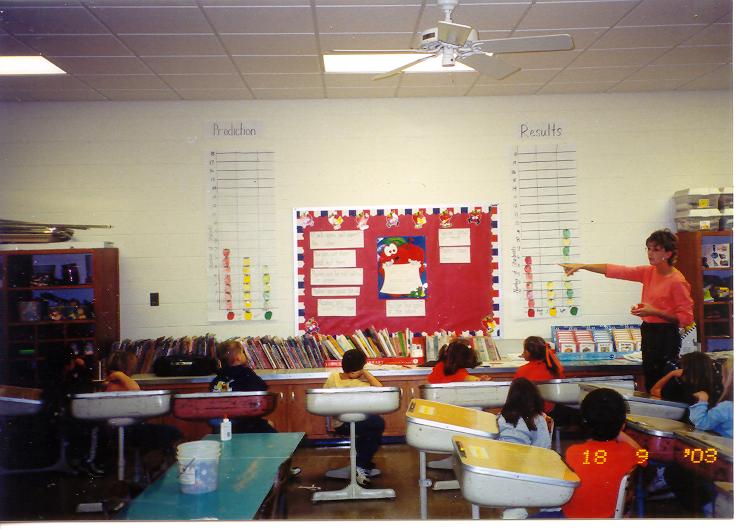
How this fits into the curriculum: This activity was done in conclusion to an apple unit. Students learned a lot about different kinds of apples, apple orchards, foods made from apples, and Johnny Appleseed. Apples were also discussed in math for adding, subtraction, and an introduction to division. As a culminating activity, we did this lesson. Students were excited to try the different kinds of apples. Some had never tried certain kinds. Students made their predictions and then compared that to what they really thought. Graphing is not a completely new activity, however this activity is a very meaningful way to use graphs to represent findings. The students then made there own graphs, which is a kind of a new skill, graphing independently. Through this application, we were certain that students really understood what they were graphing. From this, I have learned that a lot is to be said for having fun in the classroom. Doing this lesson meant some money spent, some mess made, but most importantly it meant a lot of fun and learning!


Example of Student's Individual Graph Activity.